Our production estate is roughly twenty servers spread across several providers: VPS fleets on DigitalOcean, Hetzner and IONOS managed through Laravel Forge, serverless workloads on Laravel Cloud, managed databases, plus GitHub CI, an uptime service, error tracking, and a security scanner. Every one of those has a perfectly good dashboard. That’s the problem. Eleven perfectly good dashboards. (I counted.)
When something feels off at 7am, I don’t want to know whether the API is up; I want to know whether anything, anywhere, is not right. Answering that used to mean a tab-cycling ritual across providers, coffee in hand. So I built a single-pane-of-glass operations console: one screen showing server vitals, health checks, deploys, CI status, uptime, and security findings for everything we run, with automated incident detection and Slack alerting.
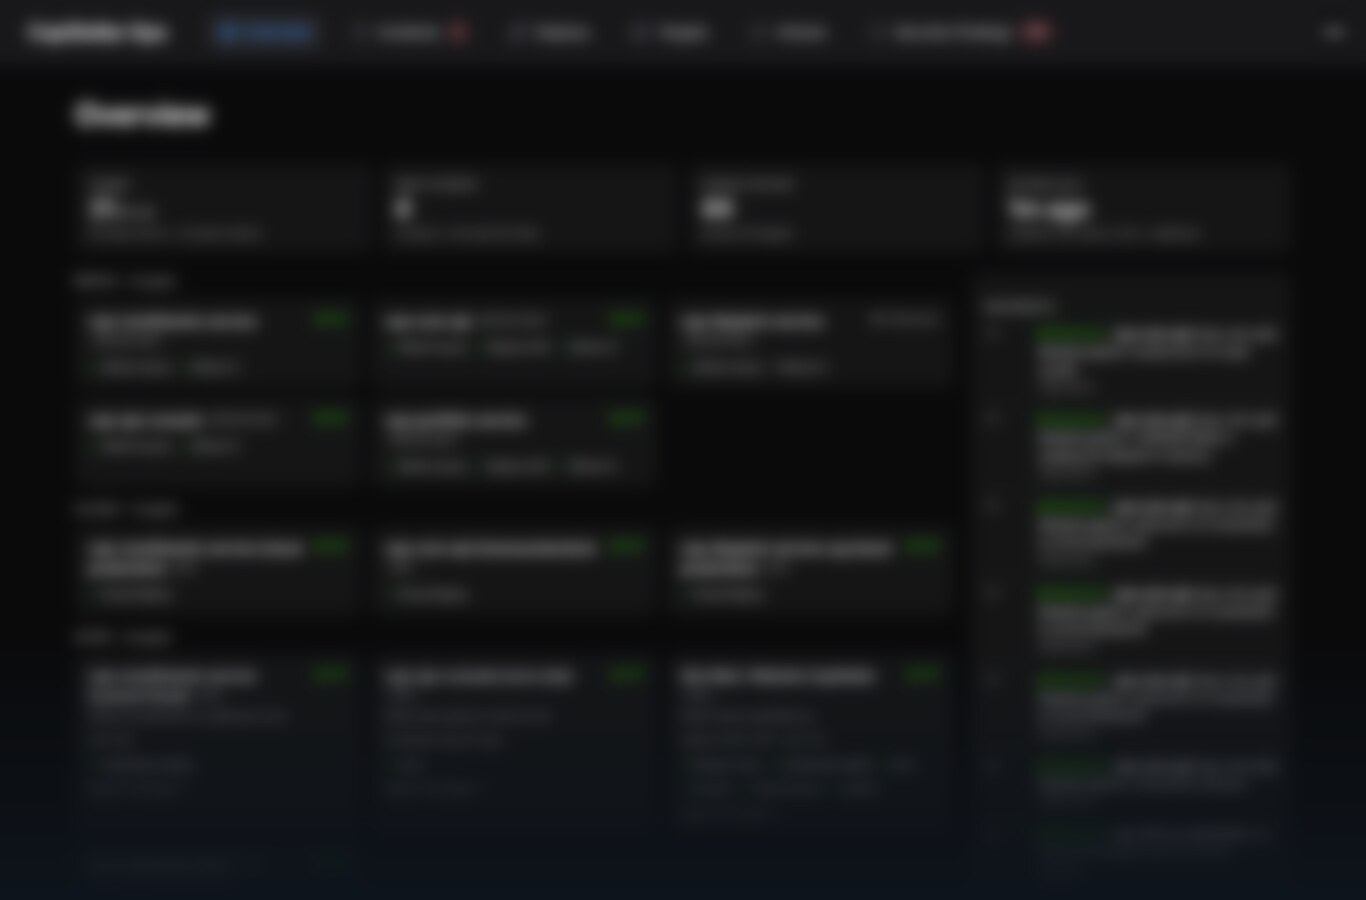
The pane itself. Blurred, because a post about watching production shouldn’t leak production.
It took a few focused days on a stack we already knew: Laravel, a queue worker, a scheduler, an admin panel. Nothing exotic. The hard part of a monitoring console isn’t collecting data; it’s earning the right to be believed.
Rule 1: collectors are read-only, and provider outages are not incidents
The console is a pure observer. A dozen small collectors poll provider APIs on schedules matched to how fast each source changes: server vitals every minute, deploys every five, security findings a few times a day. Every collector is read-only, and the console holds no credential that can change production.
Just as important: when a provider API is down, the affected checks go to unknown, never to alert. A monitoring vendor’s outage must not page anyone at 3am. And unknown renders grey, not green, because once you catch your dashboard lying to you, you never quite trust it again.
Rule 2: alerting is a state machine
(Yes, I like state machines. Eleven years later, still at it.)
Raw checks flap. A single failed poll means almost nothing; two consecutive failures mean something. Every monitored item runs through a small state machine, and a status only flips after K consecutive observations agree. A flip to warning or critical opens an incident and posts to Slack; recovery closes it with a resolution message.
Two refinements did more for our sanity than anything else:
- Re-notification is bounded. An open critical re-pings at most hourly, and acknowledging an incident silences renotification while keeping it visibly open. Whether people respect an alerting system or mute it is decided right here.
- Never enable a check before its target exists. I did this twice during the build and produced a day of alert noise each time (yes, twice, I’m a slow learner). Noise on day one poisons trust for weeks. Bring checks up dark, then enable them.
Rule 3: the console must not depend on what it watches
The console runs on its own box with its own local database and queue, deliberately independent of every production system it observes. If production has a very bad day, the screen describing that day stays up.
The inverse question matters just as much: who watches the watcher? The console’s scheduler pings an external uptime service every minute as a dead-man’s switch. If the console itself dies, the absence of that ping raises the alarm from outside. Monitoring that can fail silently is theatre.
Photo: David Masters, CC BY 2.0
Rule 4: push where agents are cheap, pull where they aren’t
Most fleet vitals come from a tiny heartbeat script on each VM: a cron posting disk, memory, and liveness to the console once a minute (a “heartbeat agent” is a big name for a small shell script). Freshness is itself a check. A heartbeat that stops arriving is a signal, the same dead-man’s-switch idea applied per machine. Services with real health endpoints get pulled instead, over the private network, with proper auth.
Was building it the right call?
The classic answer is “just buy Datadog”, and it’s fair. But our monthly cost for this is a small VPS, and the console knows things generic tooling can’t: which Forge site maps to which repo, that a hibernating serverless environment is healthy, that two installs of the same branch should be running the same commit. That last one, deploy drift, is my favourite check; it catches “deployed the API but forgot its sibling” instantly. (Not that I would know anything about that.)
There’s also this: a console you built is one you understand at incident time. Every collector, threshold, and silence rule encodes a lesson we learned the hard way. That knowledge was going to live somewhere. Better in code than in my head.
The fleet still has gaps: a box not yet on the private network, a check waiting on an endpoint. The console shows those too. A single pane of glass is only useful if it also shows what you can’t see yet.
Have fun watching your fleet.